

In the last blog post, we discussed how GCP fits into every stage of the data landscape thanks to its variety of tools. Now we’ll be honing in on two in particular that are capable of covering three stages of the process: BigQuery and Looker.
Why is BigQuery often ‘packaged up’ alongside Looker? How do these tools work together? In this post, we dive into the two technologies and why they’re often deployed side-by-side.
The TL;DR? BigQuery is the most accessible analytics platform for storing data, with rich integrations, performance and security. On the other hand, Looker is a world leader in letting business users explore and visualise data stored in performant data stores. Looker is a pioneering product that leans into self-serve business intelligence and is the key differentiator between other BI platforms.
Keep reading to discover more about how your organisation can improve by deploying these tools.
About BigQuery and Looker – The Basics
BigQuery and Looker cover two central points in the data journey - ‘Store’ and ‘Explore and Visualise’. Before you analyse your data, it needs to be stored somewhere, of course. So why do we choose BigQuery?
Simply put, BigQuery is a brilliant place to store analytical data. It can store petabytes of data and query it with ease (fun fact - it would take 3.4 years of shooting an HD video non-stop to fill up a petabyte!). It’s also great for ingesting large amounts of data, whether streaming or batch. It comes with all the cloud-based goodies we all know and love, such as high availability, robustness, and general distribution - meaning you don’t have to worry about downtime or backups. Just the sheer fact that you can query petabytes of data right at your fingertips is truly mind-blowing.
Looker, on the other hand, is a way to access that data.
Native BigQuery has only one way of gaining insight out of data tables: SQL. As good as SQL is, I'd be surprised if anyone outside of your development or data teams has any idea where to start with it. That makes the data unusable to most end-users, and that’s where Looker comes in. Looker is a data platform that allows organisations to set up and get more use out of the data sitting in a data warehouse (such as BQ).
But what does access actually mean?
Self-service business analytics (a competitive advantage)
On a high level, Looker allows any business user to extract value from organisational data, independent of their data skills. Whether it’s your end users, employees, or customers, organisational data can be delivered and analysed by them in many different ways. We call that self-serve business analytics (SSBI). We’ll outline personas, how people use Looker, and why you need SSBI if you want to drive data in your organisation.
Why SSBI?
It’s super important for organisational decision-makers to understand SSBI and how it can impact a business from the top down. SSBI is all about pairing raw data with powerful software to efficiently make sense of a vast warehouse of information. It allows users to transform raw data into visually appealing dashboards, charts, analyses and projections that improve data governance and, ultimately company performance.
One source of truth
Different departments have different objectives, but SSBI gives them access to the same data so that all departments are pulling from the same source of truth.
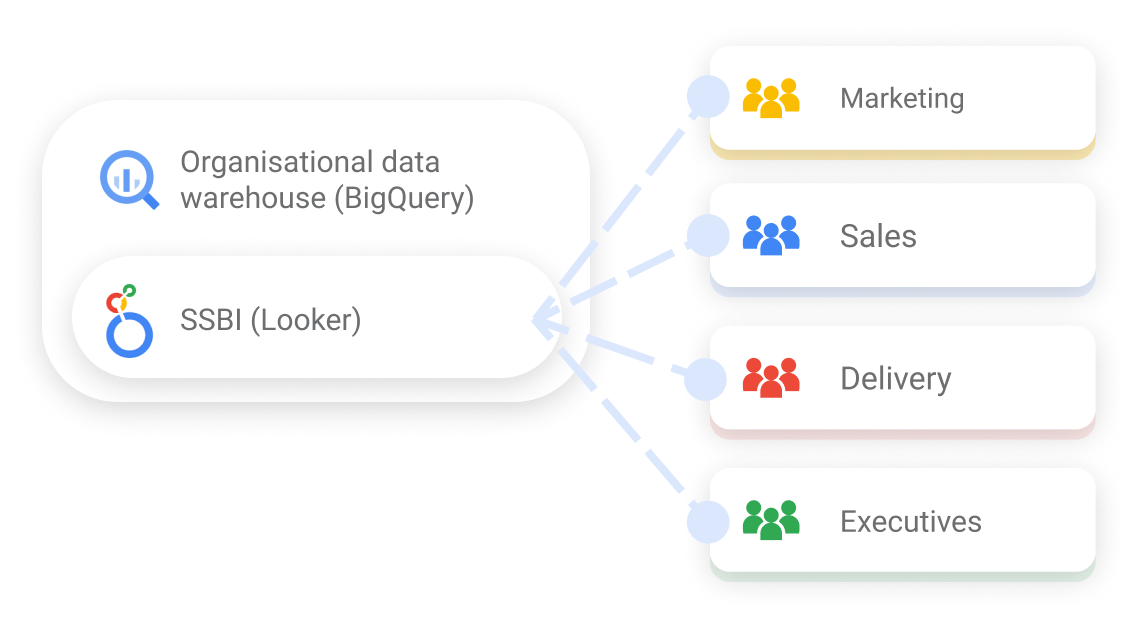
Note that when we say all departments pull from the same source of truth doesn’t mean that everyone has access to everything. The connections between people and the data can be given and taken away on a table-by-table, row-by-row or column-by-column basis; “admin giveth, admin taketh away”.
Accessibility
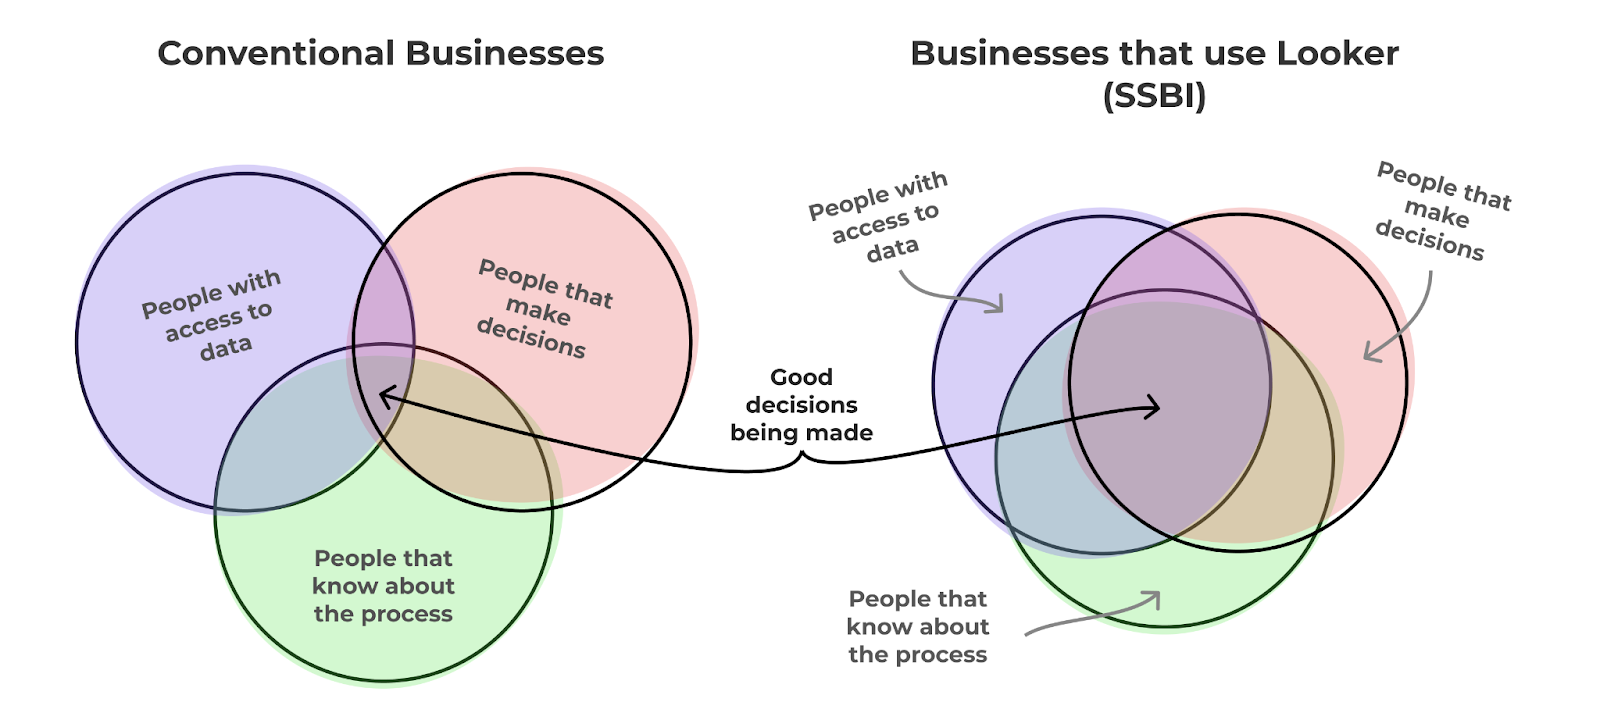
The SSBI architecture streamlines data analysis so those without a techy background or experience in business intelligence can still dip their fingers in the data to make better, data-driven decisions. Easy-to-use SSBI software is critical for companies that aim to analyse internal operations, points of improvement and opportunities for growth. Oftentimes, it’s not the analysts that can derive improvements based on the information they provide - it’s the people that live and breathe the process. Samely, the people who make the decisions aren’t usually those who have access to the data nor live and breathe the process. SSBI bridges that gap.
Basically, with the right software, anyone from a C-suite executive to an entry-level employee can use SSBI to make informed projections, visual reports, and data models. Users agree that self-service business intelligence helps their companies thrive.
The power of raw data
In order to provide insight into a company’s workings, companies must take raw data and analyse it expertly. The right SSBI program won’t limit your data ranges, enacting analysis restrictions. Instead, these platforms give businesses the power to explore data without having to place requests to the IT department or consulting outside analysts.
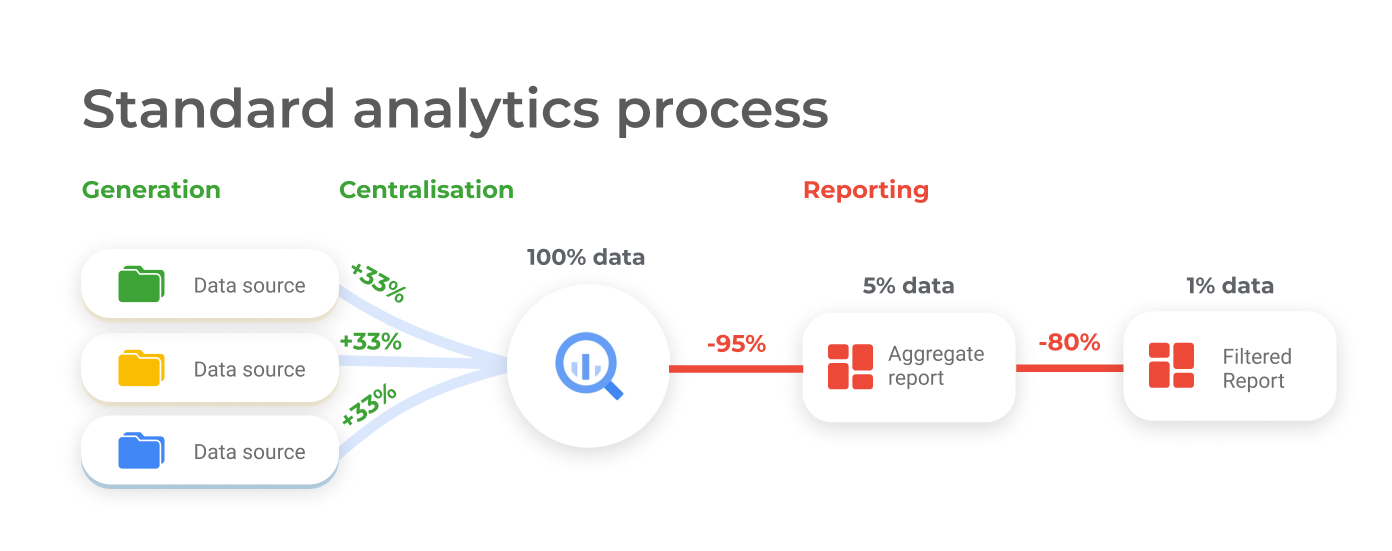
The problem with most BI toolsets, or business intelligence processes in general, is that data is lost at every step of the reporting journey. You’ve taken the time to combine datasets, join them in clever ways, but then it’s all lost when aggregated, filtered and compressed into a dashboard. Ultimately, when you look at a dashboard, you’re only looking at a tiny slither of organisational data.
This is great if the dashboard gives you everything you need to know to make a decision, but it barely ever does. You’ll ask questions such as “WHY is it that the sales are that value”, “WHY are our ticket volumes spiking at 5 pm on a Friday?” and you’ll be left staring at a bar chart telling you the stats, but nothing more. You need to be able to dive deeper into your metrics so you can start making better decisions. Here’s where SSBI comes in.
Because Looker sits ‘on top’ of your data store, every report generated by the Looker platform can be queried deeper into the data it was constructed from.
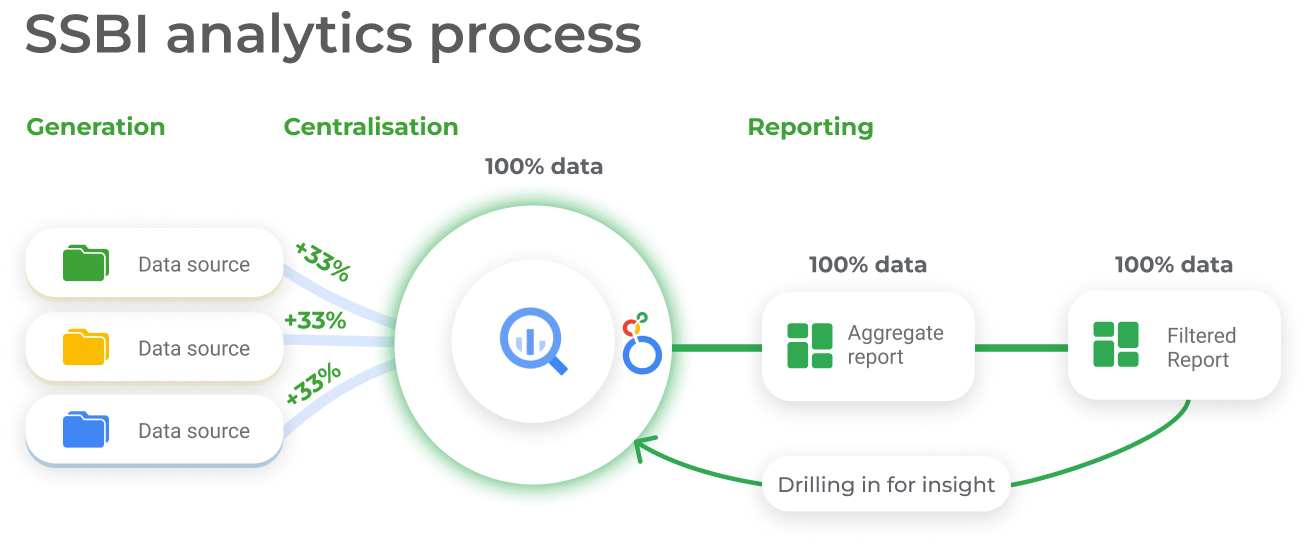
This is incredible, as it allows anyone to see the pre-prepared statistics, find out WHY the statistics are the way they are and, more importantly, take action. Every data point can be made clickable, and this can trigger workflows outside of your dashboard. For example:
- You notice that your sales are lower than usual.
- You click into your KPI that measures sales; this pulls up all deals made during this period.
- You see that one of your reps is missing from the table.
- You click on the rep's name, which takes you to their record on your HR platform.
- You see that the person is on maternity leave.
- You now have a reason for lower sales - you’re down on headcount.
If you were naively looking at the sales graph over time, only the obvious pops up - “sales are down”. That's where you disconnect from your BI platform and start asking questions. With Looker or an equivalent SSBI platform, you would be able to deduce precisely why sales are down. That’s the power of having raw data right at your fingertips.
The results
A 2016 survey found that 64% of respondents said SSBI creates a “significant competitive advantage,” while 73% agreed that “improving data visualisation is a strategic imperative.” Additionally, 57% of those surveyed said they plan to increase investment in BI.
The bottom line is that anyone with a stake in an organisation's data can use Looker, which has a lot of power when it comes to making business decisions. If you want your team to make better decisions, why not have a chat? Drop your email below, and we’ll take some time to talk!
