Looker is Google's business intelligence platform, part of GCP. From data analytics to interactive reports and visualisation, Looker is key to better understanding your organisational data and improving business decisions.
Recently, Google has made a couple of pretty significant changes to the services they have for data. From acquisitions to renames of services, it can get quite confusing. Let us un-confuse it for you.
Update 02/02/2024: Google has announced features that aim to integrate Looker with Looker Studio. You can view the presentation here. Everything below still applies. Once the updates drop, we'll update this article.
The elephant in the room 🐘
Data studio = Looker studio. Google renamed it. We can’t tell you why. If you know Data Studio, you know Looker Studio.
Looker vs Looker Studio 🔍
Let’s tackle this one first because it’s the hardest one to explain. To make it super simple, Looker is a platform used for data modelling, governance, and creating complex data systems. Looker Studio is a dashboarding tool, nothing more, nothing less.
Where the confusion lies are that people often think Looker (not Studio) is a dashboarding tool. It can do dashboards, but that’s not where its strength lies. Businesses buy Looker because they’re struggling with datasets being everywhere, people not knowing where data is, and employees being confused about metrics meaning different things.
People use Looker Studio to build pretty dashboards based on data within the business. Looker Studio connects to a bunch of data sources, and there’s no real way to model that data aside from using basic blends. Let's outline the key feature differences:
1. The Semantic Layer
You bring data into your data warehouse*, It's raw. How do you get it "analytics ready"? Well, you have to model it! In the modern data stack, that means using a tool like dbt or dataform to bring the raw tables together to something that makes sense.
You go from "stripe_transactions", "stripe_transactionTypes", and "xero_transactions" into a singular table - "transactions."
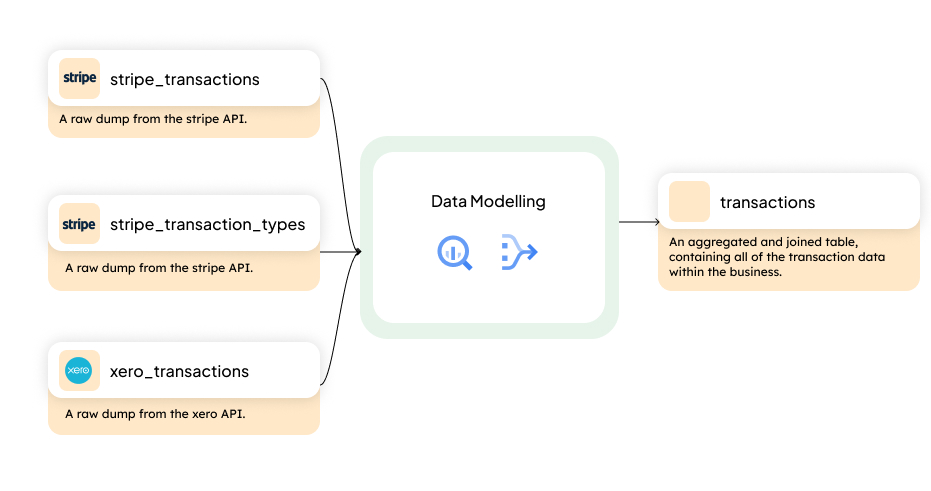
So, what's this got to do with the BI tool that you choose? Well, the problem lies that the 'transactions' table in BigQuery holds the columns that look something like "merchant_amount", "dispute", "network_data" etc. When you're trying to enable your end users to be as data-driven as possible, you need to introduce a semantic layer between this transaction table.
That's the first key difference. Looker has a semantic layer through LookML. Looker Studio connects directly to "transactions".
*If you don't have a data warehouse - you should think about that first.
A semantic layer translates 'database speak' into 'business speak'. Speaking of transactions, this is what it practically looks like when you have a semantic layer and when you don't:
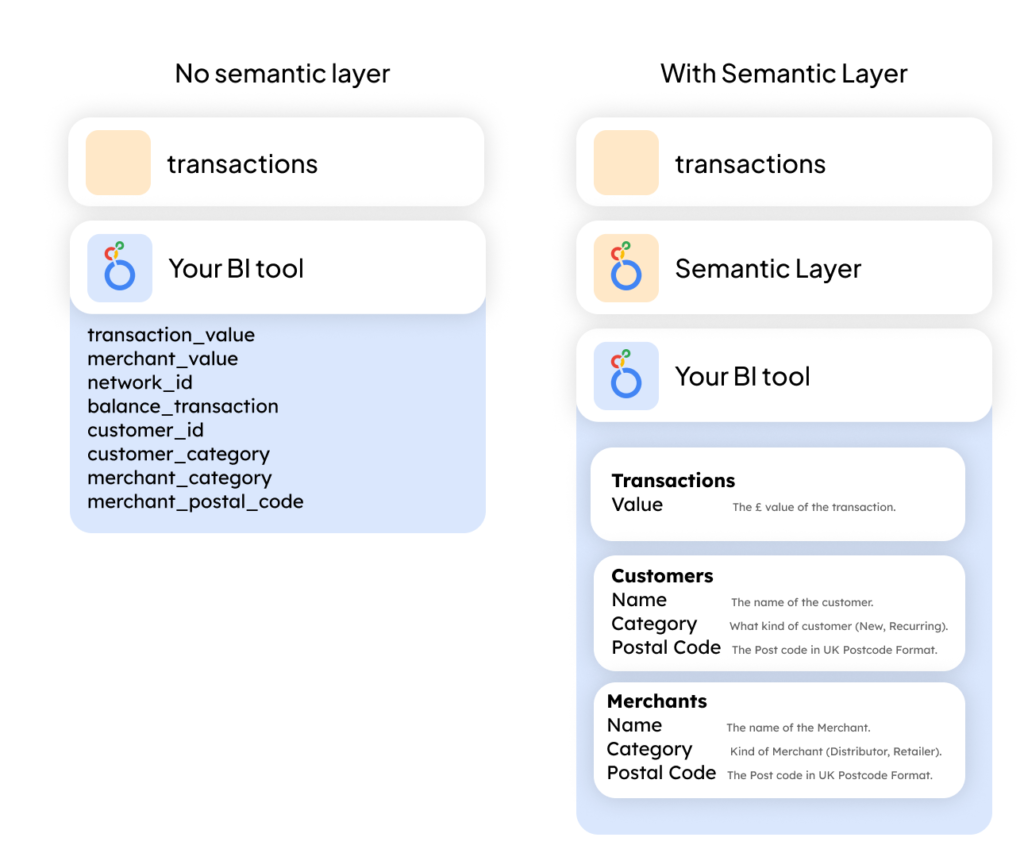
With a Semantic Layer:
- User-Friendly Labels: Instead of database column names like "merchant_amount", you might see "Amount Charged by Merchant".
- Joined Data: Data from different sources can be combined and presented as a unified view. Let's say you can bring in 'customers' - well, now you can query across 'customers' and 'transactions'.
- Calculated Fields: You can define metrics like "Total Sales" or "Average Transaction Value" directly in the semantic layer, which are then consistently used across all reports.
Without a Semantic Layer:
- Direct Database Access: Users have to understand the structure and naming conventions of the database, like the specifics of the "transactions" table.
- Limited Context: The data is presented as-is, without the additional context or calculations that might make it more meaningful.
- Potential for Misinterpretation: Without standardised calculations and naming, different users might interpret the same data in different ways, leading to inconsistent insights.
This brings us to another key aspect of choosing a BI tool: data governance and consistency. With a semantic layer, you can enforce a uniform understanding of the data across your organisation. This means that when two different teams are looking at "Total Revenue," they are both seeing the same numbers, calculated in the same way.
Moreover, a semantic layer can greatly enhance data security. By controlling access at the semantic layer, you ensure that users can only see the data they are supposed to. For instance, you might want to restrict access to sensitive information like "dispute" or "network_data" columns in the "transactions" table.
Bottom Line: Looker has a semantic layer, but Looker Studio doesn't.
2. Metric and Dashboard Management
You've successfully defined your metrics in your data warehouse; you have your data analytics ready, and your users are happy. Great.
Disaster strikes: We're changing the definition of what sales means.
This scenario is more common than you might think, and it's a critical test of your BI tool's flexibility and the robustness of your metric management.
Business requirements evolve, market conditions shift, and new compliance rules emerge. What 'sales' meant last year may not be what it means today. Perhaps you're now including online transactions or adjusting for currency fluctuations.
Every report, dashboard, and analysis relying on the 'sales' metric needs an update. This is where the right BI tool shines. A centralised metric definition through LookML means you only need to update the definition of 'sales' in one place, and every related dashboard and report reflects this change automatically.
In Looker, you have version control. Just like code, your metric definitions are version-controlled. This ensures that you can track changes over time and revert if necessary. Every person who's working on the metric definitions has their own branch and has to go through the appropriate checks to get their definition merged with the main branch.
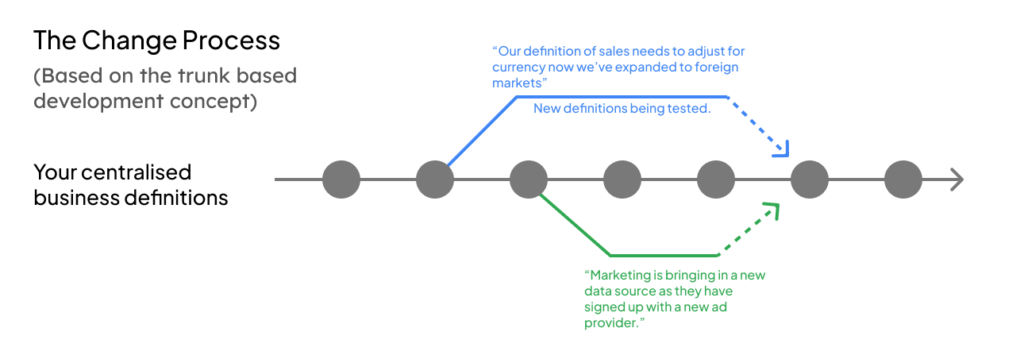
If you care about your data quality and want to introduce checks into your process, this is the perfect system for it. It brings best practices from software engineering to your data platform.
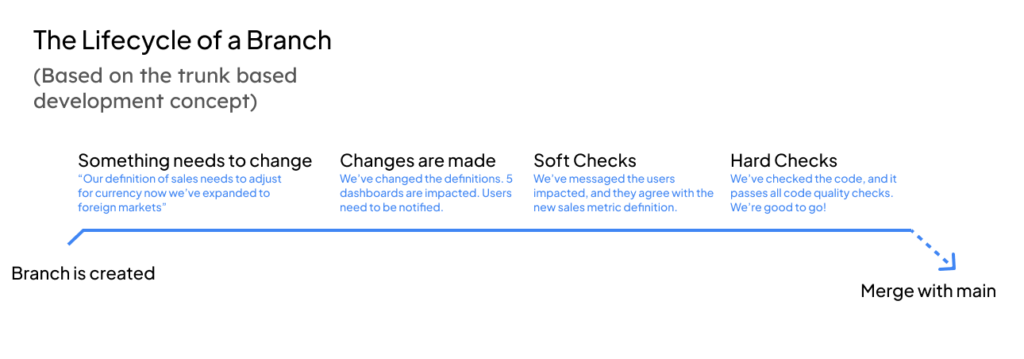
The bottom line is Looker has version control and better dashboard management, Looker Studio doesn't.
3. Beyond Dashboards
When a business invests in a BI tool, dashboarding is the first thing that comes to mind, but BI tools can do more than that. Looker Studio is great at showing dashboards but doesn't allow you to explore beyond the metrics you see on the screen. Looker offers some features that allow you to bring a layer of interactivity to your data.
Drill-In Functionality
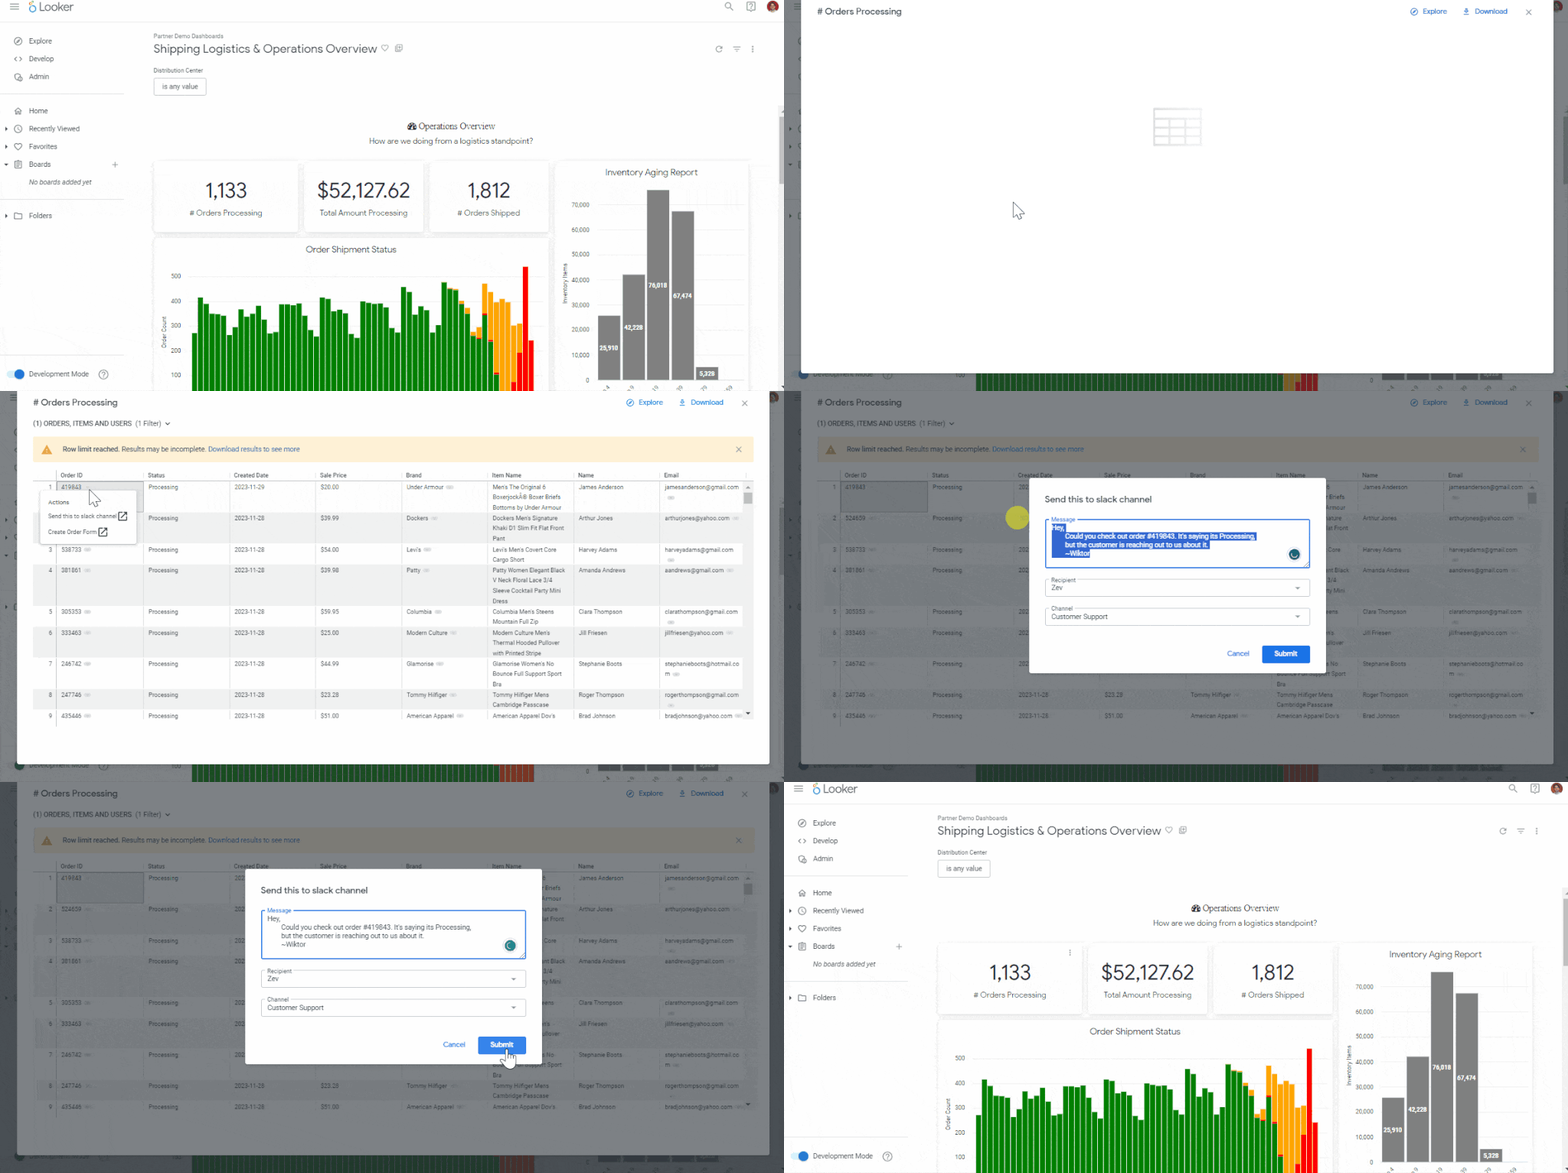
This feature allows users to delve deeper into the data behind their dashboards. For instance, you can start with a high-level view of sales by region and then drill down to see sales by individual stores or products within that region. This deeper insight is crucial for understanding the 'why' behind the 'what'.
Real-Time Alerting
In fast-paced business environments, waiting for a monthly report isn’t always feasible. Looker offers real-time alerting. This can proactively notify you when certain metrics hit predefined thresholds. For example, if sales drop below a certain point or if website traffic spikes, you can get an immediate alert.
At Cobry, we call these 'signals', because we don't think alerts do it justice. You can trigger actions based on your data thresholds, such as sending an API request to another piece of software, sending an email, or a slack message. You can create whole systems based on these 'signals'.
API Integration
Looker comes with an API, allowing you to integrate with other systems and applications or programmatically deploy dashboards, metrics, etc. This feature enables automated data flows, ensures that the data in your dashboards is current, and allows for more advanced data operations, like predictive analytics or machine learning models.
Looker Studio offers dashboarding, nothing more, nothing less. Looker offers a data API that allows users to create products based on that underlying data model.
Looker Studio vs Looker Studio Pro
Google knows people love Looker Studio (the dashboarding utility, remember?), so they’re rolling out a paid version. It has some additional team collaboration and governance features, as well as support and SLAs. For organisations that use Looker Studio heavily, you’ll find that it becomes a bit of the wild west trying to manage all of the great dashboards everyone’s putting together.
Looker Studio Pro Additional Features
- Dataplex Lineage: Dataplex is a neat GCP tool that allows you to see exactly where data flows and from what sources. If the data ended up in a Looker Studio, admins would just see a dead-end in the diagram. With Pro, you’ll see what reports the data ends up in.
- Organisational-level Permissions: You can give admins permission to view all assets created in an organisation.
- Organisation-owned content: Like shared drives, the organisation can now own Looker Studio Pro reports. This solves the pain point of a colleague leaving and their data being wiped by admins, and business critical dashboards going missing.
- (There are really cool features coming soon we’re not allowed to talk about!)
Best in unison
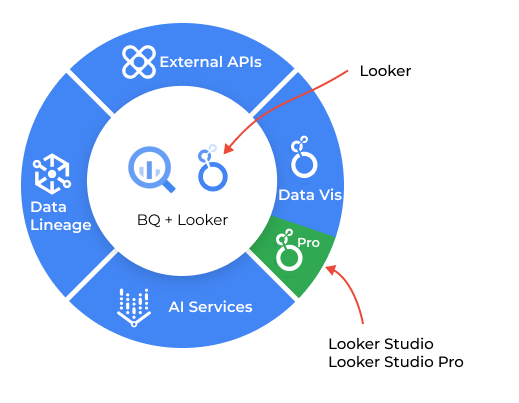
This isn’t a question of Looker OR Looker Studio - you could totally be using both.
Think of Looker as the mantle of the BI aspect of your organisation. Everything builds on top of Looker. Looker Studio is a way to access and build reports on that trusted, underlying data model.
If you need any help building out your Looker instance or your Looker Studio reports, Cobry are more than happy to lend a helping hand. Get in touch!
